Definition
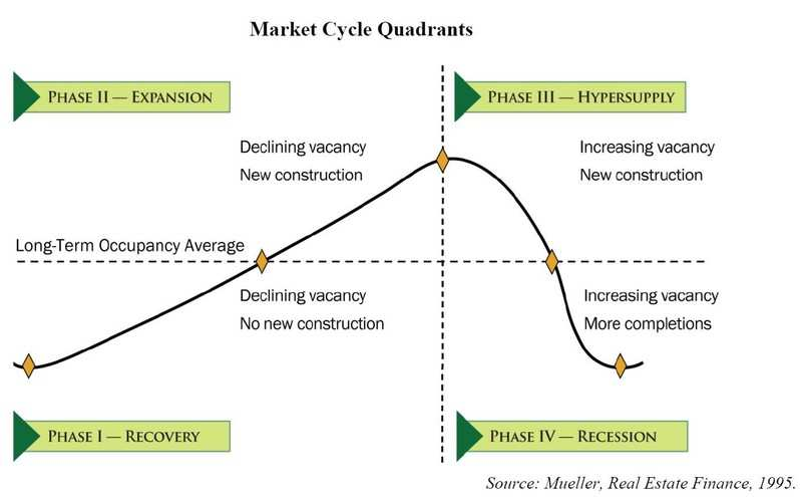
The purpose of the Emerging Markets Score (EMS) is to estimate what phase of the market cycle a given market (granularity: city) is currently in. In general, there are four components (phases) of the market cycle:
- Recovery
- Expansion
- Hypersupply
- Recession
Since our goal in phase 1 is to acquire properties at a low price point in locations where (1) equity will increase (i.e. that will appreciate quickly), (2) cash flow is strong (i.e. there is enough rental demand), we want to target markets (or sub-markets) that are at the end of phase 1/beginning of phase 2. There are six main variables we considered:
- Vacancy
- Building Permits
- Absorption Rate
- Affordability
- Job Growth
- Population Growth
For Level 1 of our marketfunnel, we assumed that the buy and hold value (derived from external lists) covers job and population growth, and so our Emerging Markets Score is built from the other four metrics.
Methodology
Variable Scores
Each of the variables have been assigned a score between 1 and 4, with 1 being the best markets (according to our strategy) and 4 being the worst. Individual acoew definitions can be found below.
Score types:
- Relative: Values are ranked evenly into percentile groups, which means their score is based on their relative value in the data set
- Absolute: Values are ranked according on absolute thresholds (e.g. rules of thumb): regardless of their relative value
- Mixed: Values are ranked relatively and then adjusted based on absolute thresholds
Note: Data was “smoothed” by assigning a percentile value to each data point.
Vacancy
Score Type: Mixed Data Granularity: Metropolitan Statistical Area (MSA)
Source: US Census Bureau
This score is based on average YOY change from vacancy levels from 2015-2018. The relative values were adjusted on the assumption that any market with quickly decreasing vacancy (>5% decrease) is top tier (score of 1) and that any market with steady to slowly increasing vacancy (<=3% YOY increase) is still worth consideration (score of 2).
Score parameters:
| Vacancy Score | Count of Metro | Min of AVG 3yr Trailing YOY | Max of AVG 3yr Trailing YOY |
| 1 | 15 | -34% | -5% |
| 2 | 27 | -5% | 3% |
| 3 | 18 | 3% | 12% |
| 4 | 16 | 12% | 36% |
| Grand Total | 76 | -34% | 36% |
Note: Data does not include most recent year (2019) and is limited to the top 76 largest MSAs.
Building Permits (New Construction)
Score Type: Mixed Data Granularity: Metropolitan Statistical Area (MSA)
Source: US Census Bureau
This score is also based on average YOY change of building permits pulled from 2015-2018. The relative values were adjust on the assumption that most “emerging” markets (score of 1) will have no to low new construction, expanding markets will have low to moderate new construction (score of 2), borderline hyper supply/hyper supply markets will have high new construction (score of 3), and markets with decreasing new construction will be in recession/recovery.
Score parameters:
| Building Permits Score | Count of Metro, State | Min of Avg 3yr Trailing YOY | Max of Avg 3yr Trailing YOY |
| 1 | 76 | -3% | 5% |
| 2 | 133 | 5% | 16% |
| 3 | 96 | 16% | 301% |
| 4 | 76 | -31% | -3% |
| Grand Total | 381 | -31% | 301% |
Note: Data does not include most recent year (2019).
Affordability
Source: Zillow research data
Score Type: Relative Data Granularity: Metropolitan Statistical Area (MSA)
Affordability is an estimate of how affordable rent is in a given market relative to the median income. For our purposes, this is important because the more “affordable” a market is, the more upward room there is for rent increases. For now we are just going to use Zillow’s version (though we cross-checked using third party data) because 1) it has more markets, 2) their estimation is more sophisticated, 3) it has data for the most recent year (2019).
From Zillow:
Mortgage Affordability, Rental Affordability and Price-to-Income Ratio are calculated as a part of Zillow’s quarterly Affordability Indices. To calculate mortgage affordability, we first calculate the mortgage payment for the median-valued home in a metropolitan area by using the metro-level Zillow Home Value Index for a given quarter and the 30-year fixed mortgage interest rate during that time period, provided by the Freddie Mac Primary Mortgage Market Survey (based on a 20 percent down payment). Then, we consider what portion of the monthly median household income (U.S. Census) goes toward this monthly mortgage payment. Median household income is available with a lag. For quarters where median income is not available from the U.S. Census Bureau, we calculate future quarters of median household income by estimating it using the Bureau of Labor Statistics’ Employment Cost Index. The affordability forecast is calculated similarly to the current affordability index but uses the one year Zillow Home Value Forecast instead of the current Zillow Home Value Index and a specified interest rate in lieu of PMMS. It also assumes a 20 percent down payment. We calculate rent affordability similarly to mortgage affordability; however we use the Zillow Rent Index, which tracks the monthly median rent in particular geographical regions, to capture rental prices.
Although the rule of thumb is anything less than 33% is “affordable,” relative values are used here because the more room to increase rent, the better.
Score Parameters:
| Affordability Score | Count of RegionID | Min of 2019 Affordability Average | Max of 2019 Affordability Average2 |
| 1 | 80 | 14% | 21% |
| 2 | 79 | 21% | 24% |
| 3 | 79 | 24% | 28% |
| 4 | 80 | 28% | 45% |
| Grand Total | 318 | 0.136144373 | 0.451583623 |
Absorption
Score Type: Relative Data Granularity: City
Absorption Rate (AR) is the rate at which houses in a specific market are being sold. It is generally used as a signal of whether the market is a buyer’s or a seller’s market. In a buyer’s market, the supply is high relative to the demand, meaning prices are low (good for the buyer). In a seller’s market, the demand is high relative to the supply, meaning prices are high (good for the seller).
Rule of Thumb (from Investopedia):
Traditionally, an absorption rate above 20% has signaled a seller’s market in which homes are sold quickly. An absorption rate below 15% is an indicator of a buyer’s market in which homes are not being sold as fast.
We consider all other markets (AR of 15%-20%) to be a “grayzone”.
Relation to Emerging Market
An “emerging” market is likely to be one where the absorption rate is increasing. When a market enters a recession, it becomes a buyer’s market as demand has fallen sharply and supply is still high after an expansion. This drives the prices down. As the market recovers, demand begins to tick back up, meaning that houses begin to sell more quickly and prices begin to rise again. So, to catch an emerging market we are looking for a buyer’s market (low absorption rate) that has YOY increases in absorption (i.e. movement in direction seller’s market), indicating a transition from recovery to expansion (but not yet a full transition into a seller’s market). On the flipside, a buyer’s market (high supply/low absorption rate) that has YOY decreases in absorption (houses are selling slower and slower) is likely in a hyper supply phase.
Relation to New Construction
From Investopedia:
Additionally, the absorption rate can be a signal for developers to start building new homes. During market conditions with a high absorption rate, demand may be high enough to warrant the further development of properties. Meanwhile, periods with lower absorption rates indicate a cooling period for construction.
This can be used as a sanity check … we should expect that markets with low absorption rates also have low construction (and vice versa). These metrics go hand in hand … low to no new construction should also mean a very low absorption rate (buyer’s market), which would indicate a market in recovery. For an emerging market: increasing (but still low) new construction should be correlated to increasing absorption (weakening buyer’s market). For hyper supply (phase 4) markets: high/increasing YOY construction should be correlated to decreasing absorption (strengthening buyer’s market).
Note: This metric should also be very useful to gauge when it’s time to cash in on a seller’s market and move equity to an emerging one.
Absorption Rate Score (New)
Given the need to refine the absolute score definition (see below), the AR Score is based on the relative value of seller’s markets (since none of the markets pulled using our base Buy & Hold lists are actually grayzone or buyers).
Score Parameters:
| TOM2019_Name | sellers | ||
| Score | Count of Region, State | Min of 2019 Absorption Rate | Max of 2019 Absorption Rate |
| 1 | 1341 | 20% | 25% |
| 2 | 1335 | 25% | 32% |
| 3 | 1336 | 32% | 41% |
| 4 | 1330 | 41% | 27569% |
| TOTAL | 5342 |
Note: The max absorption rate for tier 4 markets is based on a single (and almost certainly inaccurate) outlier value.
Emerging Market Score 1
Emerging Market Score 1 (EMS1) is calculated with two variables in our data: Vacancy and Building Permits Pulled (MSA level). Both are sourced from US Census Bureau Data In terms of vacancy and building permits pulled, the four market stages are characterized as follows (same chart as above – study this!): Since we are targeting high phase 1 to high phase 2, we want to look at areas that have declining vacancy and no to low new construction.
Note: EMS1 is useful to understand the classic relationship between vacancy and new construction. However, since it does not include the other two variables (Affordability and Absorption) it will not be included in overall value. The best use care here is to layer it on as an additional data point for deeper dives into the data. Note: If data is unavailable for either variable, the EMS1 will use the score from the other one. If both are unavailable the score will return an error.
Emerging Markets Score
Our full Emerging Markets Score (EMS) is a weighted average score of four variables – Vacancy, New Construction, Affordability and Absorption. This score is the one that will be used to estimate a market’s overall value (which moves us through level 1 of the funnel).
Note: If data is unavailable for any of the variables, the EMS will average the scores from the remaining ones. If all are unavailable the score will return an error. The “EMS Error” column counts the number of missing data points (i.e. a market with 3 EMS errors is missing three of the four variables) and can be used to filter markets based on data availability.
Other Filters
The following are other filters we used to asses the quality of markets in level 1 of our market funnel.
Rent % of Purchase Price
Score Type: Relative Data Granularity: City
Rent % is calculated as a markets median monthly rent (used: Zillow Rent Index) divided by its median purchase price.
\Score Parameters:
| Rent % Score | Count of RegionID | Min of Rent % of Purchase Price | Max of Rent % of Purchase Price 2 |
| 1 | 925 | 0.67% | 2.83% |
| 2 | 926 | 0.57% | 0.67% |
| 3 | 926 | 0.48% | 0.57% |
| 4 | 926 | 0.15% | 0.48% |
Price to Rent
Score Type: Mixed Data Granularity: City
Price to Rent Ratio is the reverse of Rent %. It is calculated by dividing a markets median sales price by its median annual rent (rolled up from Zillow Rent Index). This Score was adjusted based on the standard rule of thumb:
| Price to Rent Ratio Rule of Thumb | |
| <15 | Much better to buy than rent |
| 16 – 20 | Maybe to rent than buy |
| 21> | Much better to rent than buy |
Score Parameters:
| Price to Rent Score | Count of RegionID | Min of Price to Rent | Max of Price to Rent 2 |
| 1 | 1852 | 2.81 | 14.62 |
| 2 | 1481 | 14.62 | 20.46 |
| 3 | 371 | 20.49 | 53.90 |
Median Sales Price
Score Type: Relative Data Granularity: City
Definition: Self-explanatory 🙂
Score Parameters:
| Median Sales Price Score | Count of RegionID | Min of Median Sales Price (2019 Average) | Max of Median Sales Price (2019 Average) |
| 1 | 978 | $ 30,190.00 | $ 179,150.00 |
| 2 | 978 | $ 179,336.36 | $ 249,250.00 |
| 3 | 978 | $ 249,310.00 | $ 353,510.00 |
| 4 | 978 | $ 353,545.45 | $ 2,937,245.45 |
Granularity Info
- The United States Office of Management and Budget (OMB) has defined 384 metropolitan statistical areas (MSAs) for the United States and eight for Puerto Rico.
- The OMB defines a Metropolitan Statistical Area as one or more adjacent counties or county equivalents that have at least one urban core area of at least 50,000 population, plus adjacent territory that has a high degree of social and economic integration with the core as measured by commuting ties.
- The OMB defines a Micropolitan Statistical Area as one or more adjacent counties or county equivalents that have at least one urban core area of at least 10,000 population but less than 50,000, plus adjacent territory that has a high degree of social and economic integration with the core as measured by commuting ties.[1]
- The data in Zillow’s Real Estate Market Reports are aggregated from public sources by a number of data providers for 928 metropolitan and micropolitan areas dating back to 1996.
- An incorporated place in the United States includes cities, towns, villages and municipalities, among other designations. As of 2015, there are over 300 incorporated places in the United States that have a population that exceeds 100,000, which is a pretty sizable increase over the 285 recorded in 2012.
- As of 2016, there were 3,007 counties, 64 parishes, 19 organized boroughs, 10 census areas, 41 independent cities, and the District of Columbia for a total of 3,142 counties and county-equivalents in the 50 states and District of Columbia.
- A core-based statistical area (CBSA) is a U.S. geographic area defined by the Office of Management and Budget (OMB) that consists of one or more counties (or equivalents) anchored by an urban center of at least 10,000 people plus adjacent counties that are socioeconomically tied to the urban center by commuting.
hjj